| Customization |
  |
Style Page
| Note
Click on the page tabs below to get help on pages in the Property Editor.
|
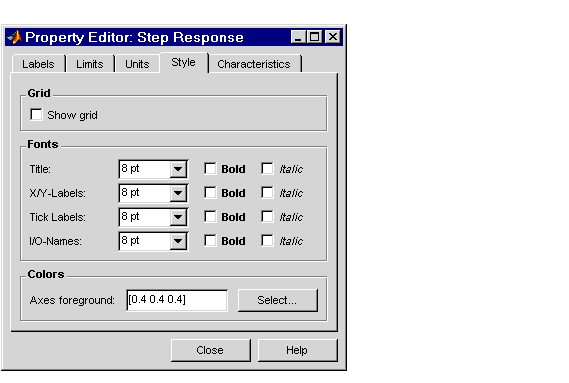
Use the Style page to toggle grid visibility and set font preferences and axes foreground colors for response plots.
You have the following choices:
- Grid -- Activate grids by default in new plots
- Fonts -- Set the font size, weight (bold), and angle (italic)
- Colors -- Specify the color vector to use for the axes foreground, which includes the X-Y axes, grid lines, and tick labels. Use a three-element vector to represent red, green, and blue (RGB) values. Vector element values can range from 0 to 1.
- If you do not want to specify RGB values numerically, press the Select button to open the Select Colors window. See Select colors for more information.
 | Units Page | | Characteristics Page |  |


