
| Getting Started |   |
Comparing Linear and Nonlinear Models
Suppose you want to compare the linearized step response between the Stick Input to the Pitch Rate, q, to the step response of the original nonlinear model.
The basic procedure for carrying out this type of analysis is outlined in the remaining sections, which present the F14 example in detail.
Opening the Simulink LTI Viewer
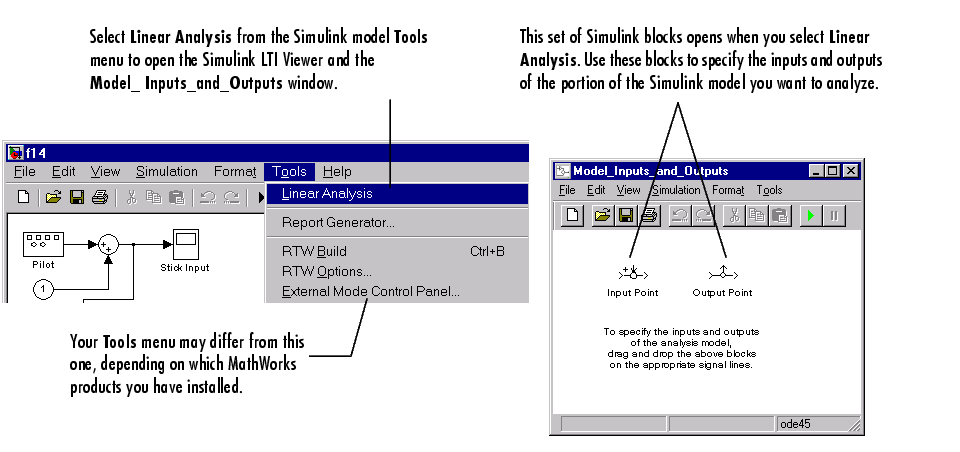
To open a Simulink LTI Viewer linked to the f14 Simulink model:
When you select Linear Analysis, two new windows open, an empty Simulink LTI Viewer window and a Simulink diagram called Model_Inputs_and_Outputs, which contains Input Point and Output Point blocks.
This figure shows how to open the Model_Inputs_and_Outputs diagram.

Figure 3-20: Opening the Model_Inputs_and_Outputs Dialog Box from Simulink
The next section shows how you can select inputs and outputs for the linearized model.
Specifying the Simulink Model Portion for Analysis
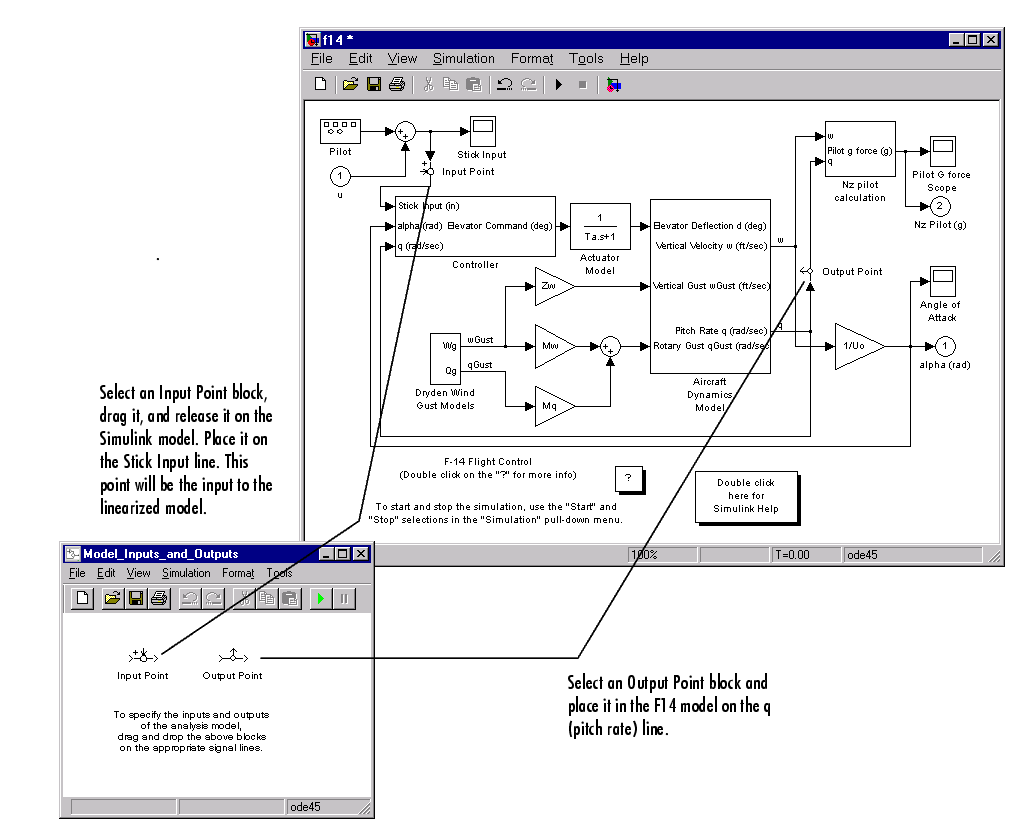
To specify the portion of the Simulink model you want to analyze, mark its input and output signals on the Simulink model using the Input Point and Output Point blocks in the Model_Inputs_and_Outputs window. This defines an input/output relationship that is linearized and analyzed by the LTI Viewer. This to-be-linearized portion of your model is called the analysis model.
To set up the analysis model for the f14 Simulink model:
This figure illustrates the procedure for adding linearization input and output points to the f14 model.

Figure 3-21: Selecting Input and Output Points for the Linearized Portion of the F14 Model
Keep the following in mind when using the Input Point and Output Point blocks to specify analysis models:
Default Operating Conditions
The operating conditions are the values of the state and input vectors about which the linearization of the analysis model occurs. Initial conditions are the values of the state and input vectors at time t=0. By default, Simulink sets the initial conditions to zero; for more information on setting initial conditions in Simulink, see the Using Simulink documentation.
The Simulink LTI Viewer by default assumes that the operating conditions are the initial conditions set in Simulink for the model. This is the case in the F14 example, where the initial and operating conditions are set to zero. You can, however, select any operating conditions you require; see Specifying Operating Conditions for more information.
Performing Linear Analysis
Once you have specified your analysis model, and (optionally) set the operating conditions, you are ready to analyze it with the Simulink LTI Viewer.
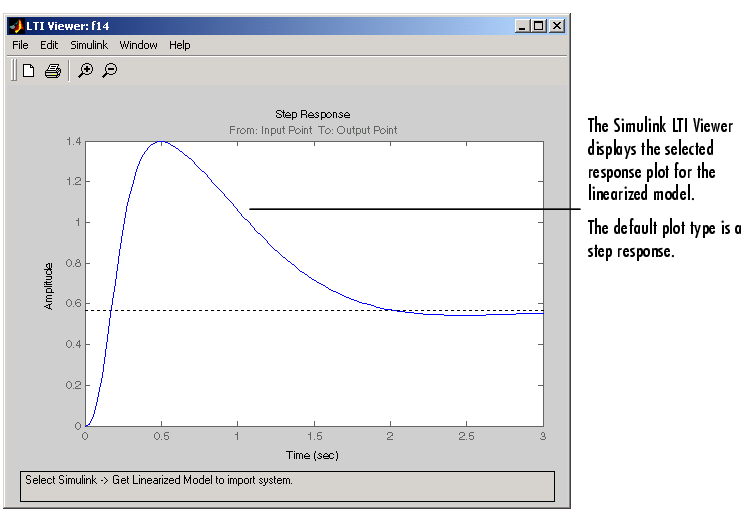
To perform the linearization and import your linearized f14 model into the LTI Viewer, select Get Linearized Model in the Simulink menu on the LTI Viewer. This produces the following response plot.

Figure 3-22: Step Response from Stick Input to Pitch Rate for the Linearized F14 Model
Each time you select Get Linearized Model in the LTI Viewer's Simulink menu, the LTI Viewer relinearizes the model and adds the new analysis model to the list of models available to the viewer. The Simulink LTI Viewer maintains a history of the linearized models, which is useful for comparing models when varying parameters.
You can view the linearized models in the LTI Viewer or change the plot type using the right-click menus.
Comparing the Step Response of the Linear and Nonlinear F14 Models
To compare the linear and nonlinear step responses, you must generate a step response for the original (nonlinear) f14 model.
To do this, follow these steps:
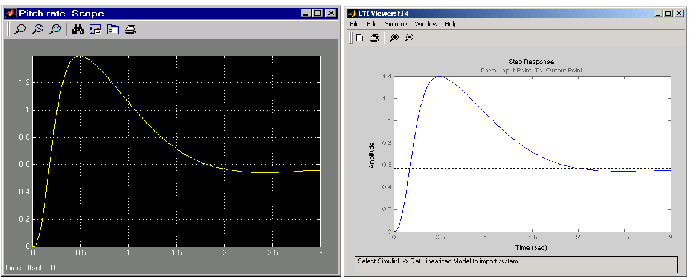
The output to the Pitch Rate Scope block is on the left side of this figure.

Figure 3-23: Comparison of Step Responses from Stick Input to Pitch Rate for the Nonlinear and Linear F14 Models, Respectively
As these two graphs demonstrate, the agreement between the linear and nonlinear models is quite good.
 | Using the Simulink LTI Viewer | Bode Plots of Linearized Models |  |