| MATLAB Function Reference | |
Calculates isosurface and patch colors
Syntax
nc = isocolors(X,Y,Z,C,vertices)
nc = isocolors(X,Y,Z,R,G,B,vertices)
nc = isocolors(C,vertices)
nc = isocolors(R,G,B,vertices)
nc = isocolors(...,PatchHandle)
isocolors(...,PatchHandle)
Description
nc = isocolors(X,Y,Z,C,vertices)
computes the colors of isosurface (patch object) vertices (vertices) using color values C. Arrays X, Y, Z define the coordinates for the color data in C and must be monotonic vectors or 3-D plaid arrays (as if produced by meshgrid). The colors are returned in nc. C must be 3-D (index colors).
nc = isocolors(X,Y,Z,R,G,B,vertices)
uses R, G, B as the red, green, and blue color arrays (truecolor).
nc = isocolors(C,vertices), nc = isocolors(R,G,B,vertices)
assumes X, Y, and Z are determined by the expression:
nc = isocolors(...,PatchHandle)
uses the vertices from the patch identified by PatchHandle.
isocolors(...,PatchHandle)
sets the FaceVertexCData property of the patch specified by PatchHandle to the computed colors.
Indexed Color Data
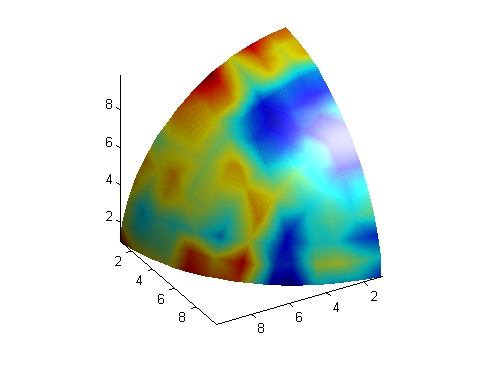
This example displays an isosurface and colors it with random data using indexed color. (See Interpolating in Indexed Color vs. Truecolor for information on how patch objects interpret color data.)
[x y z] = meshgrid(1:20,1:20,1:20);
data = sqrt(x.^2 + y.^2 + z.^2);
cdata = smooth3(rand(size(data)),'box',7);
p = patch(isosurface(x,y,z,data,10));
isonormals(x,y,z,data,p);
isocolors(x,y,z,cdata,p);
set(p,'FaceColor','interp','EdgeColor','none')
view(150,30); daspect([1 1 1]);axis tight
camlight; lighting phong;
Truecolor Data
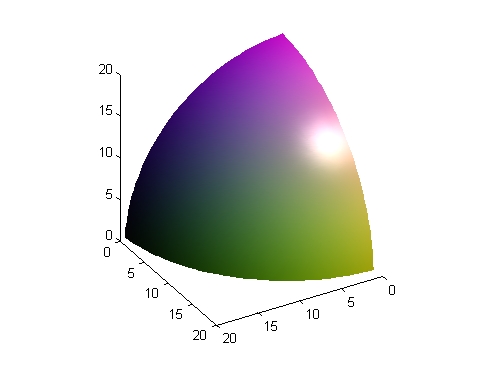
This example displays an isosurface and colors it with truecolor (RGB) data.
[x y z] = meshgrid(1:20,1:20,1:20);
data = sqrt(x.^2 + y.^2 + z.^2);
p = patch(isosurface(x,y,z,data,20));
isonormals(x,y,z,data,p);
[r g b] = meshgrid(20:-1:1,1:20,1:20);
isocolors(x,y,z,r/20,g/20,b/20,p);
set(p,'FaceColor','interp','EdgeColor','none')
view(150,30); daspect([1 1 1]);
camlight; lighting phong;
Modified Truecolor Data
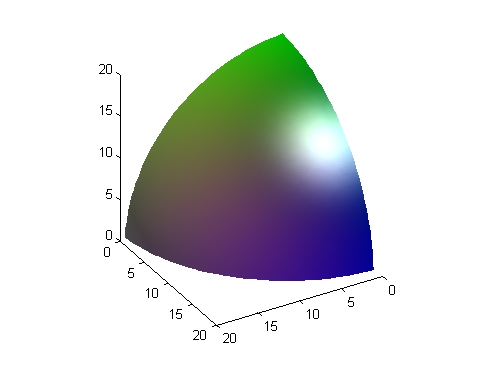
This example uses isocolors to calculate the truecolor data using the isosurface's (patch object's) vertices, but then returns the color data in a variable (c) in order to modify the values. It then explicitly sets the isosurface's FaceVertexCData to the new data (1-c).
[x y z] = meshgrid(1:20,1:20,1:20);
data = sqrt(x.^2 + y.^2 + z.^2);
p = patch(isosurface(data,20));
isonormals(data,p);
[r g b] = meshgrid(20:-1:1,1:20,1:20);
c = isocolors(r/20,g/20,b/20,p);
set(p,'FaceVertexCData',1-c)
set(p,'FaceColor','interp','EdgeColor','none')
view(150,30); daspect([1 1 1]);
camlight; lighting phong;
See Also
isosurface, isocaps, smooth3, subvolume, reducevolume, reducepatch, isonormals.
Volume Visualization for related functions
| | isocaps | isonormals | |