| Wavelet Toolbox | |
Detecting Long-Term Evolution
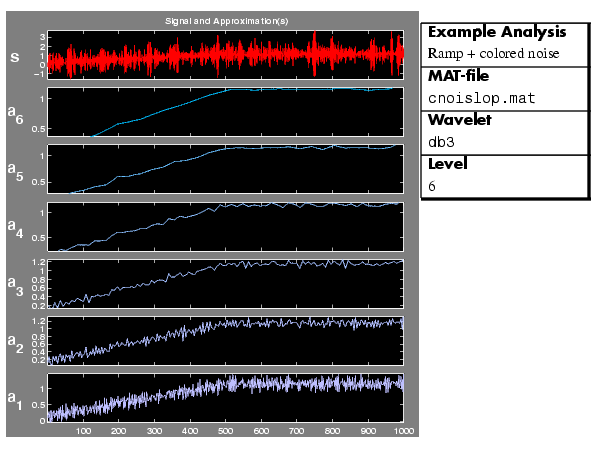
The purpose of this example is to show how analysis by wavelets can detect the overall trend of a signal. The signal in this case is a ramp obscured by "colored" (limited-spectrum) noise. (We have zoomed in along the x-axis to avoid showing edge effects.)
There is so much noise in the original signal, s, that its overall shape is not apparent upon visual inspection. In this level-6 analysis, we note that the trend becomes more and more clear with each approximation, A1 to A6. Why is this?
The trend represents the slowest part of the signal. In wavelet analysis terms, this corresponds to the greatest scale value. As the scale increases, the resolution decreases, producing a better estimate of the unknown trend.
Another way to think of this is in terms of frequency. Successive approximations possess progressively less high-frequency information. With the higher frequencies removed, what's left is the overall trend of the signal.
Discussion
Wavelet analysis is useful in revealing signal trends, a goal that is complementary to the one of revealing a signal hidden in noise. It's important to remember that the trend is the slowest part of the signal. If the signal itself includes sharp changes, then successive approximations look less and less similar to the original signal.
Consider the demo analysis File Example AnalysisBasic SignalsStep signal (MAT-file
 wstep.mat). It is instructive to analyze this signal using the Wavelet 1-D tool and see what happens to the successive approximations. Try it.
| | Detecting Discontinuities and Breakdown Points II | Detecting Self-Similarity | |