| Statistics Toolbox | |
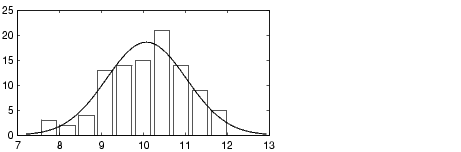
Histogram with superimposed normal density
Syntax
Description
histfit(data,nbins)
data using nbins bars in the histogram. With nbins is omitted, its value is set to the square root of the number of elements in data.
h = histfit(data,nbins)
h(1) is the handle to the histogram, h(2) is the handle to the density curve.
Example
| | hist | hougen | |