

| Function Reference | |
Derive state-space model from block diagram description
Syntax
Description
Complex dynamical systems are often given in block diagram form. For systems of even moderate complexity, it can be quite difficult to find the state-space model required in order to bring certain analysis and design tools into use. Starting with a block diagram description, you can use append and connect to construct a state-space model of the system.
to specify each block sysj in the diagram and form a block-diagonal, unconnected LTI model sys of the diagram.
to connect the blocks together and derive a state-space model sysc for the overall interconnection. The arguments Q, inputs, and outputs have the following purpose:
Q indicates how the blocks on the diagram are connected. It has a row for each input of sys, where the first element of each row is the input number. The subsequent elements of each row specify where the block input gets its summing inputs; negative elements indicate minus inputs to the summing junction. For example, if input 7 gets its inputs from the outputs 2, 15, and 6, where the input from output 15 is negative, the corresponding row of Q is [7 2 -15 6]. Short rows can be padded with trailing zeros (see example below).
sys and Q, connect computes a state-space model of the interconnection with the same inputs and outputs as sys (that is, the concatenation of all block inputs and outputs). The index vectors inputs and outputs then indicate which of the inputs and outputs in the large unconnected system are external inputs and outputs of the block diagram. For example, if the external inputs are inputs 1, 2, and 15 of sys, and the external outputs are outputs 2 and 7 of sys, then inputs and outputs should be set to
Since it is easy to make a mistake entering all the data required for a large model, be sure to verify your model in as many ways as you can. Here are some suggestions:
sys match the poles of the various blocks in the diagram.
step and bode responses of sysc and compare them with your expectations.
The connect function does support delays in a reliable way. If you need to work extensively with block diagrams or you need to interconnect models with time delays, Simulink is a much easier and more comprehensive tool for model building.
Example
Consider the following block diagram
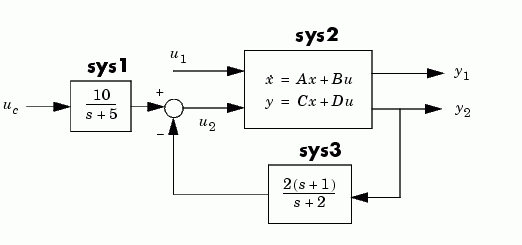
Given the matrices of the state-space model sys2
A = [ -9.0201  17.7791
      -1.6943  3.2138 ];
B = [ -.5112  .5362
      -.002  -1.8470];
C = [ -3.2897  2.4544
      -13.5009  18.0745];
D = [-.5476  -.1410
     -.6459  .2958 ];
Define the three blocks as individual LTI models.
sys1 = tf(10,[1 5],'inputname','uc')
sys2 = ss(A,B,C,D,'inputname',{'u1' 'u2'},...
                    'outputname',{'y1' 'y2'})
sys3 = zpk(-1,-2,2)
Next append these blocks to form the unconnected model sys.
This produces the block-diagonal model
sys

a =
                        x1           x2           x3           x4
           x1           -5            0            0            0
           x2            0      -9.0201       17.779            0
           x3            0      -1.6943       3.2138            0
           x4            0            0            0           -2


b =
                        uc           u1           u2            ?
           x1            4            0            0            0
           x2            0      -0.5112       0.5362            0
           x3            0       -0.002       -1.847            0
           x4            0            0            0       1.4142
c =
                        x1           x2           x3           x4
            ?          2.5            0            0            0
           y1            0      -3.2897       2.4544            0
           y2            0      -13.501       18.075            0
            ?            0            0            0      -1.4142


d =
                        uc           u1           u2            ?
            ?            0            0            0            0
           y1            0      -0.5476       -0.141            0
           y2            0      -0.6459       0.2958            0
            ?            0            0            0            2

Continuous-time system.
Note that the ordering of the inputs and outputs is the same as the block ordering you chose. Unnamed inputs or outputs are denoted b.
To derive the overall block diagram model from sys, specify the interconnections and the external inputs and outputs. You need to connect outputs 1 and 4 into input 3 (u2), and output 3 (y2) into input 4. The interconnection matrix Q is therefore
Note that the second row of Q has been padded with a trailing zero. The block diagram has two external inputs uc and u1 (inputs 1 and 2 of sys), and two external outputs y1 and y2 (outputs 2 and 3 of sys). Accordingly, set inputs and outputs as follows.
You can obtain a state-space model for the overall interconnection by typing
sysc = connect(sys,Q,inputs,outputs)

a =
                        x1           x2           x3           x4
           x1           -5            0            0            0
           x2      0.84223     0.076636       5.6007      0.47644
           x3      -2.9012      -33.029       45.164      -1.6411
           x4      0.65708      -11.996        16.06      -1.6283


b =
                        uc           u1
           x1            4            0
           x2            0    -0.076001
           x3            0      -1.5011
           x4            0     -0.57391


c =
                        x1           x2           x3           x4
           y1     -0.22148      -5.6818       5.6568     -0.12529
           y2      0.46463      -8.4826       11.356      0.26283


d =
                        uc           u1
           y1            0     -0.66204
           y2            0     -0.40582

Continuous-time system.
Note that the inputs and outputs are as desired.
See Also
append Append LTI systems
feedback Feedback connection
minreal Minimal state-space realization
parallel Parallel connection
series Series connection
References
[1] Edwards, J.W., "A Fortran Program for the Analysis of Linear Continuous and Sampled-Data Systems," NASA Report TM X56038, Dryden Research Center, 1976.
| | conj | covar | |