
| Getting Started |   |
Setting Plot Preferences and Properties
The Control System Toolbox provides three graphical user interfaces (GUIs) that give you control over the visualization of time and frequency plots generated by the toolbox:
Preferences refer to global options that you can save from session to session or to any LTI Viewer or SISO Design Tool that you open during a single session. Properties are options that apply only to the current window. This section gives an overview of the three GUI's; see the online help system for a complete descriptions
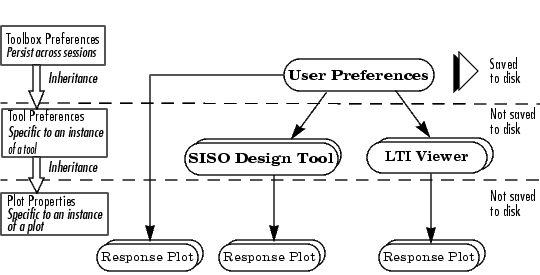
Although you can set plot properties in any response plot, you can use the Toolbox Preferences Editor to set properties for any response plot the Control System Toolbox generates. This figure shows the inheritance hierarchy from toolbox preference to plot properties.

Figure 5-1: Preference and Property Inheritance Hierarchy
You can activate preference and plot editors by doing the following:
For a complete discussion of how to use property and preference editors, see Customization" in the online help under Control System Toolbox.
 | Online Help | The MathWorks Online |  |