| Using Simulink | |
The coverage report generated by the Model Coverage Tool contains the following sections.
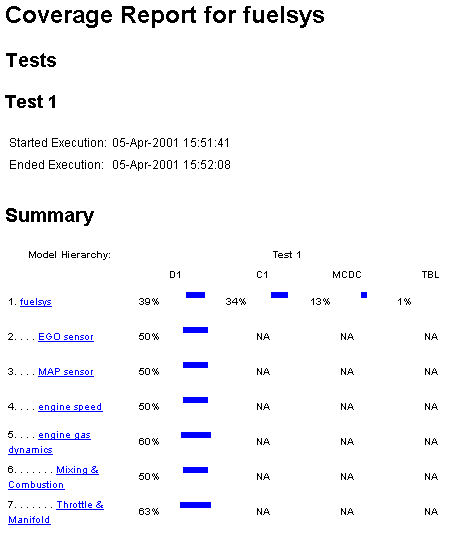
Coverage Summary
The coverage summary section has two subsections: Tests and Summary.
cvtest command.
Details
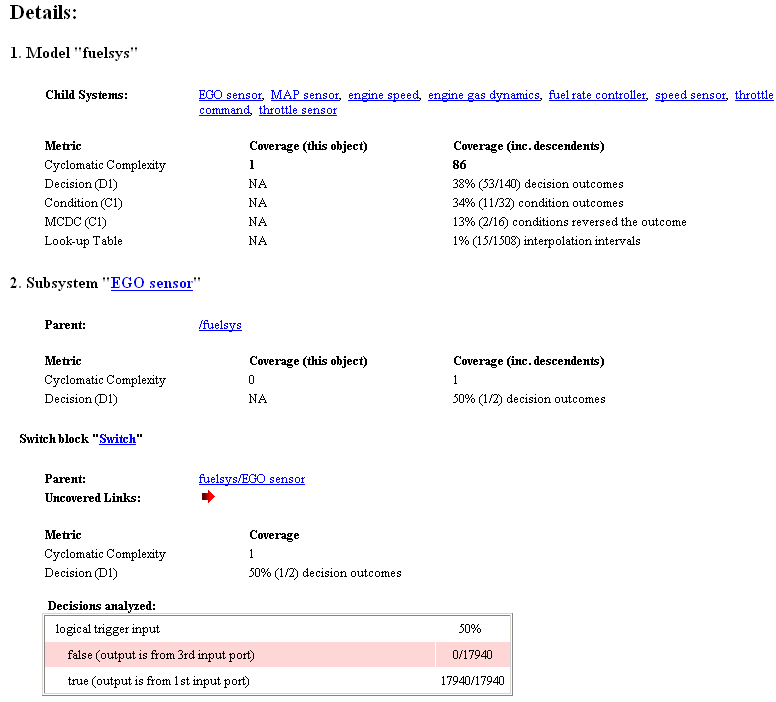
The "Details" section reports the model coverage results in detail.
The "Details" section starts with a summary of results for the model as a whole followed by a list of subsystems and charts that the model contains. Subsections on each subsystem and chart follow. Clicking the name of a subsystem or chart in the model summary takes you to a detailed report on that subsystem or chart. The section for each subsystem starts with a summary of the test coverage results for the subsystem and a list of the subsystems that it contains. The overview is followed by block reports, one for each block that contains a decision point in the subsystem.
Each section of the detailed report summarizes the results for the metrics used to test the object (model, subsystem, chart, block) to which the section applies. The sections for models and subsystems give results for the model and subsystem considered as a covered object and for the contents of the model or subsystem.
Each section may include coverage results for more than one simulation run. The report reports the results for each simulation run in a separate column. A numeric prefix in the column heading indicates the run that produced the data.
Detail Tables and Charts
Each section can includes tables or charts that give detailed results for the metrics used to test the object. The following sections describe these tables and charts.
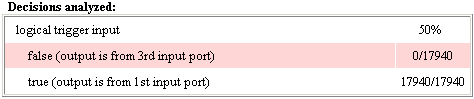
Decisions analyzed. This table applies to the decision metric. It lists possible outcomes for a decision and the number of times that an outcome occurred in each test simulation.
The report highlights outcomes that did not occur in red. Clicking the block name causes Simulink to display the block diagram containing the block. Simulink also highlights the block to help you find it in the diagram.
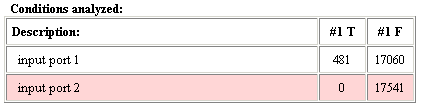
Conditions analyzed. This table lists the number of occurrences of true and false conditions on each input port of a block.
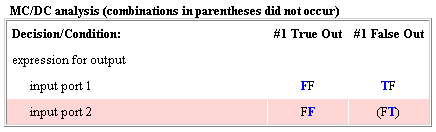
MC/DC analysis. This table lists the MC/DC input condition cases represented by the corresponding block and the extent to which the reported test cases cover the condition cases.
Each row of the table represents a condition case for a particular input to the block. A condition case for input n of a block is a combination of input values such that changing the value of input n alone is sufficient to change the value of the block's output. Input n is called the deciding input of the condition case.
The table uses a condition case expression to represent a condition case. A condition case expression is a character string where
T means true, F means false).
For example, FTF represents a condition case for a three-input block where the second input is the deciding input.
The table's Decision/Condition column specifies the deciding input for an input condition case. The #1 True Out column specifies the deciding input value that causes the block to output true value for a condition case. The #1 True Out entry uses a condition case expression, e.g., FF, to express the values of all the inputs to the block, with the value of the deciding variable indicated by bold formatting.
Parentheses around the expression indicate that the specified combination of inputs did not occur during the first (or only) test case included in this report. In other words, the test case did not cover the corresponding condition case. The #1 False Out column specifies the deciding input value that causes the block to output a false value and whether the value actually occurred during the first (or only) test case included in the report. The report adds additional #n True Out and #n False out columns for additional test cases, where n is the number of the test case.
If you selected Treat Simulink Logic blocks as short-circuited in the Coverage Settings dialog box (see Coverage Settings Dialog Box), MC/DC coverage analysis does not check whether short-circuited inputs actually occur. The MC/DC details table uses an x in a condition expression (e.g., TFxxx) to indicate short-circuited inputs that were not analyzed by the tool.
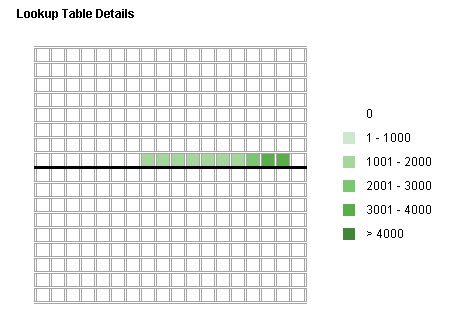
Lookup Table Details. This section displays an interactive chart that summarizes the extent to which the test cases covered the corresponding lookup table. You can click elements of the chart to view details of the coverage. Here is how to interpret and interact with the chart.
If the corresponding block is a 1-D LUT block, the chart displays a 1-D array of cells. If the corresponding block is a 2-D LUT block, this section displays a 2-D array of cells.
In either case, each cell represents index entries, also known as breakpoints, in the lookup table. A cell's border represents a set of adjacent table entries:
nth index (or row index in the case of a 2-D table).
n+1th index (or row index).
nth column index.
n+1th column index.
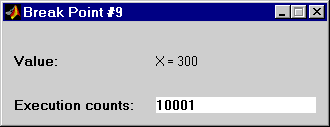
A bold border segment indicates that at least one block input equal to the corresponding index occurred during the simulation. Click the border to display the exact number of hits for the corresponding index value.
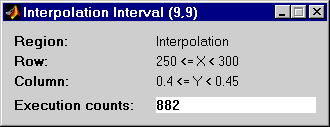
A cell's interior represents a table interpolation interval where the LUT block interpolates output values for inputs that occur in the interval. A shaded interior indicates that at least one input (or pair of inputs in the case of a 2-D block) occurred at the breakpoints or inside the interpolation interval of the cell. The intensity of the shading is proportional to the number of occurrences. The scale next to the chart shows the relationship between the shading intensity and the number of table interval/breakpoint hits.
The outermost cells of the chart represent the table's extrapolation region. An extrapolation cell is visible only if inputs occurred in the corresponding extrapolation region. However, you can interact with any of the extrapolation cells, including invisible cells. Clicking an extrapolation cell displays the number of occurrences of inputs in the corresponding extrapolation region.
Navigation Arrows. The section for each block contains a backward and a forward arrow. Clicking the forward arrow takes you to the next section in the report that lists an uncovered outcome. Clicking the back arrow takes you back to the previous uncovered outcome in the report.
Chart Report
The detailed report for each Stateflow chart has a similar format, with decision tables for each state and transition in the chart. Note that information about Stateflow coverage is included in the Stateflow documentation.
| | Creating and Running Test Cases | Coverage Settings Dialog Box | |