
| Getting Started |   |
LTI Viewer
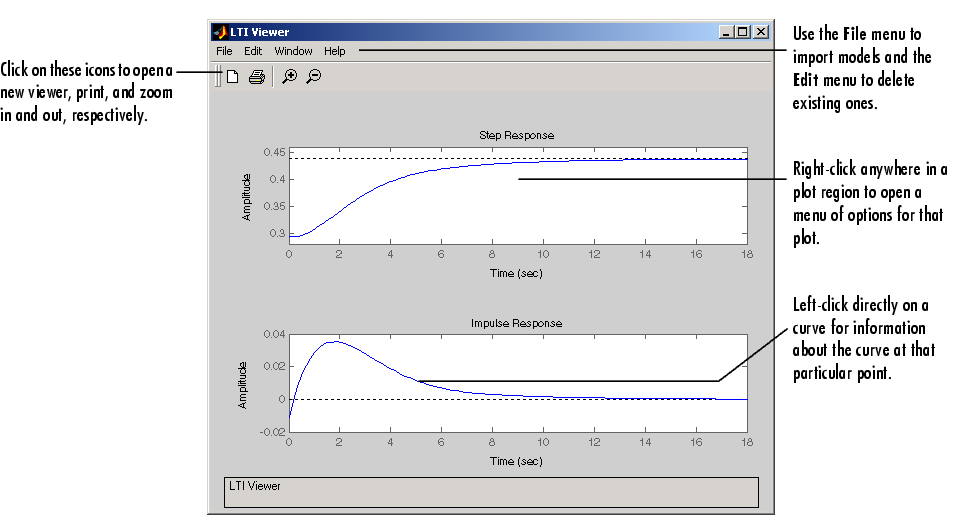
This figure shows an LTI Viewer with two response plots.

Figure 3-1: The LTI Viewer with Step and Impulse Response Plots
The next section presents an example that shows you how to import a system into the LTI Viewer and how to customize the viewer to fit your requirements.
 | Analyzing Models | Example: Time and Frequency Responses of the DC Motor |  |